Articles

Read the latest articles relevant to your clinical practice, including exclusive insights from Healthed surveys and polls.

By reading selected clinical articles, you earn CPD in the Educational Activities (EA) category whenever you click the “Claim CPD” button and follow the prompts. 
Prof Andrew Whitehouse

New Australian autism guidelines, released today, aim to provide a nationally consistent and rigorous standard for how children and adults are assessed and diagnosed with autism, bringing to an end the different processes that currently exist across the country. There is no established biological marker for all people on the autism spectrum, so diagnosis is not a straightforward task. A diagnosis is based on a clinical judgement of whether a person has autism symptoms, such as social and communication difficulties, and repetitive behaviours and restricted interests. This is an inherently subjective task that depends on the skill and experience of the clinician. This judgement is made even more difficult by the wide variability in symptoms, and the considerable overlap with a range of other developmental conditions such as attention deficit/hyperactivity disorder (ADHD), intellectual disability, and developmental language disorder. Further complicating autism diagnosis in Australia is the lack of consistent diagnostic practices both within and between states and territories. This leads to patchy and inconsistent rules around who can access public support services, and the types of services that are available. It is not uncommon in Australia for a child to receive a diagnosis in the preschool years via the health system, for instance, but then require a further diagnostic assessment when they enter the education system. This is a bewildering situation that has a significant impact on the finite financial and emotional resources of families and the state. The new guidelines aim to address these inconsistencies and help people with autism and their families better navigate state-based support services. It also brings them into line with the principles of the National Disability Insurance Scheme (NDIS), which seeks to determine support based on need rather than just a diagnosis.

National guidelines

In June 2016, the National Disability Insurance Agency (NDIA) and the Cooperative Research Centre for Living with Autism (Autism CRC), where I’m chief research officer, responded to these challenges by commissioning the development of Australia’s first national guidelines for autism assessment and diagnosis. We undertook a two-year project that included wide-ranging consultation and extensive research to assess the evidence. The guidelines do not define what behaviours an individual must show to be diagnosed with autism. These are already presented in international manuals, such as the American Psychiatric Association’s Diagnostic and Statistical Manual (DSM-5) and the World Health Organisation’s International Classification of Diseases (ICD-11). What the new guidelines provide is a detailed description of the information that needs to be collected during a clinical assessment and how this information can be used to inform the ongoing support of that person, including through a diagnosis of autism. The guidelines include 70 recommendations describing the optimal process for the assessment and diagnosis of autism in Australia.

Understanding strengths and challenges

A diagnostic assessment is not simply about determining whether a person does or doesn’t meet criteria for autism. Of equal importance is gaining an understanding about the key strengths, challenges and needs of the person. This will inform their future clinical care and how services are delivered. In essence, optimal clinical care is not just about asking “what” diagnosis an individual may have, but also understanding “who” they are and what’s important to their quality of life. We know diagnosis of autism alone is not a sound basis on which to make decisions about eligibility for support services such as the NDIS and state-based health, education and social support systems. Some people who meet the diagnostic criteria for autism will have minimal support needs, while other individuals will have significant and urgent needs for support and treatment services but will not meet diagnostic criteria for autism at the time of assessment. Some people may have an intellectual disability, for example, but not show the full range of behaviours that we use to diagnose autism. Others may present with the latter, but not the former. In the context of neurodevelopmental conditions such as autism, it is crucial that a persons’s needs – not the presence or absence of a diagnostic label – are used to determine eligibility and prioritisation of access to support services.

What may influence an autism assessment?

The guidelines also detail individual characteristics that may influence the presentation of autism symptoms. Gender is one key characteristic. Males are more commonly diagnosed with autism than females. But there is increasing evidence that autism behaviours may be different in males and females. Females may be better able to “camouflage” their symptoms by using compensatory strategies to “manage” communication and social difficulties. It is similarly important to consider the age of the person being assessed, because the presentation of autism symptoms changes during life. The guidelines provide information on how gender and age affect the behavioural symptoms of autism. This will ensure clinicians understand the full breadth of autistic behaviours and can perform an accurate assessment. The next step is for all clinicians and autism service providers across Australia to adopt and implement the guidelines. This will ensure every child and adult with autism can receive the optimal care and support.
Victorian Assisted Reproductive Treatment Authority (VARTA)

Fertility Week 2018 starts on October 15. This year’s message, Healthy You, Healthy Baby encourages men and women to consider their health before conception to improve their chance of conceiving, and to do their best for their baby’s future health. It has been known for some time that the general environment of a uterus can cause epigenetic changes to a fetus, but there is now growing evidence that the health of both parents before and at the time of conception influences their chance of conceiving and the short and long-term health of their child. The environment where eggs and sperm mature and the composition of the fluid in the fallopian tube when fertilisation takes place are affected by parents’ general health. So, in addition to the genetic material parents contribute to their children, the health of their eggs and sperm health at the time of maturation and conception has lasting effects on the expression of the genes and the health of the future child. Obesity, smoking, environmental toxins, alcohol, drugs, lack of physical activity and poor nutrition all pose risks to the health of egg and sperm and consequently to the health of a future child. Chronic health conditions such as diabetes and hypertension can also adversely affect gamete health.

Why promoting preconception health in primary health care is important

Whether they are actively trying for a baby or not, people of reproductive age can potentially conceive any time. This is why preconception health messages need to be integrated into primary health care and discussed opportunistically with women and men of reproductive age whenever possible.

Screening for pregnancy intention

A condition for preconception health optimisation is that the pregnancy is planned. To reduce the risk of unintended pregnancy, the ‘Guidelines for preventive activities in general practice’ recommend screening for pregnancy intention in primary health care settings. A promising method for assessing the risk of unintended pregnancy and giving prospective parents the opportunity to optimise their preconception health is the One Key Question® (OKQ) initiative developed by the Oregon Foundation for Reproductive Health. It proposes that women are asked ‘Would you like to become pregnant in the next year?’ as a routine part of primary health care to identify the reproductive health services they need to either avoid pregnancy or increase the chances of a successful one. This non-judgemental approach allows practitioners to provide advice about reliable contraception if the answer is ‘no’ and information about preconception health if the answer is ‘yes’ or ‘maybe’.

Providing preconception health information and care

While a 15-minute consultation will not allow in depth discussions about contraception or preconception health, directing women to reliable sources of information and inviting them to make a time to come back to discuss their reproductive health needs in light of their pregnancy intentions might increase awareness of the importance of preconception health optimisation. Considering the mounting evidence about the role of paternal preconception health for fertility and the health of offspring, men also need to be made aware of the importance of being in the best possible shape in preparation for fatherhood. Directing men to accessible and reliable sources of information about male reproductive health can improve awareness about how they can contribute to the long-term health of their children.

Quality resources

Your Fertility is the Commonwealth Government funded national fertility health promotion program that improves awareness among people of reproductive age and health and education professionals about potentially modifiable factors that affect fertility and reproductive outcomes. A media campaign planned for Fertility Week will encourage men and women to seek the information they need from their GP. The Your Fertility website, www.yourfertility.org.au is designed to assist time-poor practitioners to direct their patients through evidence-based, up-to-date, accessible information about all aspects of female and male reproductive health. Resources on the Fertility Week page include videos from fertility experts, facts sheets and messages tailored for both men and women. Short videos produced for health professionals feature Dr Magdalena Simonis, GP, and Associate Professor Kate Stern, fertility specialist, who both describe their approaches to raising lifestyle issues and fertility with male and female patients of reproductive age. The RACGP’s preconception care checklist for practitioners is available from www.racgp.org.au/AJGP/2018/July/Preconception-care Visit the Your Fertility website content, fact sheets for health professionals and patients help promote the important messages about how healthy parents make heathy babies.   Visit the Your Fertility Website View the Preconception Care Checklist    
Allison Sigmund

In Australia 12-14% of pregnancies are affected by gestational diabetes. Despite its prevalence, most people aren’t aware the risks don’t end when the pregnancy does. Diabetes occurs when the level of glucose (sugar) in the blood is higher than normal. Cells in the pancreas control blood glucose levels by producing insulin. When these cells are destroyed, type 1 diabetes results. When the body becomes resistant to the action of insulin and not enough insulin can be made, this is known as type 2 diabetes. Resistance to insulin action occurs for many reasons, including increasing age and body fat, low physical activity, hormone changes, and genetic makeup. Gestational diabetes occurs when high blood glucose levels are detected for the first time during pregnancy. Infrequently, this is due to previously undiagnosed diabetes. More commonly, the diabetes is only related to pregnancy. Pregnancy hormones reduce insulin action and increase insulin demand, in a similar way to type 2 diabetes, but usually after the baby is born, hormones and blood glucose levels go back to normal. Read more: Weight gain during pregnancy: how much is too much?

Who gets gestational diabetes?

Factors that increase the risk of gestational diabetes include:
  • a strong family history of diabetes
  • weight above the healthy range
  • non Anglo-European ethnicity
  • being an older mum.
Weight is the major risk factor that can be changed. But in some cases, gestational diabetes may develop without any of these risk factors. Rates of gestational diabetes in Australia have approximately doubled in the last decade. Increased testing for gestational diabetes, changing population characteristics, and higher rates of overweight and obesity may have contributed to this. There are likely to be other factors we do not fully understand.   >> Read More Source: The Conversation
Dr Nelson Chong

A stressful event, such as the death of a loved one, really can break your heart. In medicine, the condition is known as broken heart syndrome or takotsubo syndrome. It is characterised by a temporary disruption of the heart’s normal pumping function, which puts the sufferer at increased risk of death. It’s believed to be the reason many elderly couples die within a short time of each other. Broken heart syndrome has similar symptoms to a heart attack, including chest pain and difficulty breathing. During an attack, which can be triggered by a bereavement, divorce, surgery or other stressful event, the heart muscle weakens to the extent that it can no longer pump blood effectively. In about one in ten cases, people with broken heart syndrome develop a condition called cardiogenic shock where the heart can’t pump enough blood to meet the body’s needs. This can result in death.

Physical damage

It has long been thought that, unlike a heart attack, damage caused by broken heart syndrome was temporary, lasting days or weeks, but recent research suggest that this is not the case. A study by researchers at the University of Aberdeen provided the first evidence that broken heart syndrome results in permanent physiological changes to the heart. The researchers followed 52 patients with the condition for four months, using ultrasound and cardiac imaging scans to look at how the patients’ hearts were functioning in minute detail. They discovered that the disease permanently affected the heart’s pumping motion. They also found that parts of the heart muscle were replaced by fine scars, which reduced the elasticity of the heart and prevented it from contracting properly. In a recent follow-up study, the same research team reported that people with the broken heart syndrome have persistent impaired heart function and reduced exercise capacity, resembling heart failure, for more than 12 months after being discharged from hospital.

Long-term risk

A new study on the condition, published in Circulation, now shows that the risk of death remains high for many years after the initial attack. In this study, researchers in Switzerland compared 198 patients with broken heart syndrome who developed cardiogenic shock with 1,880 patients who did not. They found that patients who experienced cardiogenic shock were more likely to have had the syndrome triggered by physical stress, such as surgery or an asthma attack, and they were also significantly more likely to have died five years after the initial event. People with major heart disease risk factors, such as diabetes and smoking, were also much more likely to experience cardiogenic shock, as were people with atrial fibrillation (a type of heart arrythmia). A second study from Spain found similar results among 711 people with broken heart syndrome, 11% of whom developed cardiogenic shock. Over the course of a year, cardiogenic shock was the strongest predictor of death in this group of patients. These studies show that cardiogenic shock is not an uncommon risk factor in broken heart syndrome patients, and it is a strong predictor of death. They shed light on a condition that was previously thought to be less serious than it is. The evidence now clearly shows that the condition is not temporary and it highlights an urgent need to establish new and more effective treatments and careful monitoring of people with this condition.
Dr David Kanowski

Short or tall stature is considered to be height below or above the 3rd or 97th percentile respectively. Abnormal growth velocity, showing on serial height measurements, is also an important finding. Growth charts based on the US NHANES study are available from www.cdc.gov/growthcharts/charts.htm. Copies of growth charts, together with height velocity and puberty charts are available at the Australasian Paediatric Endocrine Group (APEG) website, https://apeg.org.au/clinical-resources-links/growth-growth-charts/. Local Australian growth charts are currently not available. The height of the parents should be considered in evaluating the child. Expected final height can be calculated from the parents’ heights as follows: For boys: Expected final height = mean parental height + 6.5cm For girls: Expected final height = mean parental height – 6.5cm Assessment of bone age (hand/wrist) is also useful. With familial short or tall stature, bone age matches chronological age. Conversely, in a child with pathological short stature, bone age is often well behind chronological age, and may continue to fall if the disease is untreated. The stage of puberty is relevant, as it will affect the likely final height. A short child who is still pre-pubertal (with unfused epiphyses) is more likely to achieve an adequate final height than one in late puberty.

Short stature

Causes to consider include:
  • Malnutrition, the commonest cause worldwide
  • Chronic disease, for example, liver/renal failure, chronic inflammatory diseases
  • Growth hormone deficiency, with/without other features of hypopituitarism
  • Other endocrinopathies, for example, hypothyroidism, (rarely) Cushing’s syndrome
  • Genetic/syndromic causes, for example, Down, Turner, Noonan, Prader-Willi syndromes
  • Depression or social deprivation should also be considered
  • Idiopathic short stature is a diagnosis of exclusion
Appropriate initial screening investigations can include liver and renal function tests, blood count, iron studies, thyroid function tests, coeliac disease screen, thyroid function tests, urinalysis (including pH) and karyotype. Other specialised tests may be needed, based on suspicion. In the lower range, IGF-1 shows considerable overlap between normal and abnormal levels, especially in the setting of poor nutrition. Small children tend to have low levels, regardless of whether growth hormone deficiency is the underlying cause. Random growth hormone levels vary widely because of pulsatile secretion and are also not a reliable test. Therefore, unless there is a clear underlying genetic or radiological diagnosis associated with clearly low IGF-1, stimulation testing is typically required to formally diagnose growth hormone deficiency and may be essential for funding of growth hormone treatment.

Tall stature

Causes include:
  • Chromosomal abnormalities, for example, Klinefelter syndrome (qv), XYY syndrome
  • Marfan syndrome
  • Homocystinuria
  • Hyperthyroidism
  • Growth hormone excess (see Acromegaly; Growth hormone; Insulin-like growth factor-1 (IGF-1))
  • Precocious puberty
  • Other syndromic causes, for example, Sotos, Beckwith-Wiedemann syndromes
  • Familial tall stature (predicted final height should match mid-parental height)
Investigation of stature is a specialised area and early discussion with a paediatric endocrinologist is indicated if there is clinical concern, for example, height below the 3rd percentile at age five, slow growth (crossing two percentile lines away from the median), significant height/ weight discrepancy (more than two centile lines), suspected/confirmed metabolic or genetic abnormality, or clinical evidence of malnutrition or marked obesity.

References

  1. Cohen P, Rogol AD, Deal CL, Saenger P, Reiter EO, Ross JL, et al. Consensus statement on the diagnosis and treatment of children with idiopathic short stature: a summary of the Growth Hormone Research Society, the Lawson Wilkins Pediatric Endocrine Society, and the European Society for Paediatric Endocrinology workshop. J Clin Endocrinol Metab. 2008 Nov; 93(11): 4210-7. DOI: [10.1210/jc.2008-0509]
  2. Nwosu BU, Lee MM. Evaluation of short and tall stature in children. Am Fam Physician. 2008 Sep 1; 78(5): 597-604. Available from: www.aafp.org/afp/2008/0901/p597.pdf.
  General Practice Pathology is a regular column each authored by an Australian expert pathologist on a topic of particular relevance and interest to practising GPs. The authors provide this editorial free of charge as part of an educational initiative developed and coordinated by Sonic Pathology.
Dr Amanda Henry

Women often wonder what the “right” length of time is after giving birth before getting pregnant again. A recent Canadian study suggests 12-18 months between pregnancies is ideal for most women. But the period between pregnancies, and whether a shorter or longer period poses risks, is still contested, especially when it comes to other factors such as a mother’s age. It’s important to remember that in high-income countries most pregnancies go well regardless of the gap in between.

What is short and long

The time between the end of the first pregnancy and the conception of the next is known as the interpregnancy interval. A short interpregnancy interval is usually defined as less than 18 months to two years. The definition of a long interpregnancy interval varies – with more than two, three or five years all used in different studies. Most studies look at the difference every six months in the interpregnancy interval makes. This means we can see whether there are different risks between a very short period in between (less than six months) versus just a short period (less than 18 months). Most subsequent pregnancies, particularly in high-income countries like Australia, go well regardless of the gap. In the recent Canadian study, the risk of mothers having a severe complication varied between about one in 400 to about one in 100 depending on the interpregnancy interval and the mother’s age. The risk of stillbirth or a severe baby complication varied from just under 2% to about 3%. So overall, at least 97% of babies and 99% of mothers did not have a major issue. Some differences in risk of pregnancy complications do seem to be related to the interpregnancy interval. Studies of the next pregnancy after a birth show that:

What about other factors?

How much of the differences in complications are due to the period between pregnancies versus other factors such as a mother’s age is still contested. On the one hand, there are biological reasons why a short or a long period in between pregnancies could lead to complications. If the gap is too short, mothers may not have had time to recover from the physical stressors of pregnancy and breastfeeding, such as pregnancy weight gain and reduced vitamin and mineral reserves. They may also not have completely recovered emotionally from the previous birth experience and demands of parenthood. If the period between pregnancies is quite long, the body’s helpful adaptations to the previous pregnancy, such as changes in the uterus that are thought to improve the efficiency of labour, might be lost. However, many women who tend to have a short interpregnancy interval also have characteristics that make them more at risk of pregnancy complications to start with – such as being younger or less educated. Studies do attempt to control for these factors. The recent Canadian study took into account the number of previous children, smoking and the previous pregnancy outcomes, among other things. Even so, they concluded that risks of complications were modestly increased with a lower-than-six-month interpregnancy period for older women (over 35 years) compared to a 12-24-month period. Other studies, however, including a 2014 West Australian paper comparing different pregnancies in the same women, have found little evidence of an effect of a short interpregnancy interval.

So, what’s the verdict?

Based on 1990s and early 2000s data, the World Health Organisation recommends an interpregnancy interval of at least 24 months. The more recent studies would suggest that this is overly restrictive in high-resource countries like Australia. Although there may be modestly increased risks to mother and baby of a very short gap (under six months), the absolute risks appear small. For most women, particularly those in good health with a previously uncomplicated pregnancy and birth, their wishes about family spacing should be the major focus of decision-making. In the case of pregnancy after miscarriage, there appears even less need for restrictive recommendations. A 2017 review of more than 1 million pregnancies found that, compared to an interpregnancy interval of six to 12 months or over 12 months, an interpregnancy interval of less than six months had a lower risk of miscarriage and preterm birth, and did not increase the rate of pre-eclampsia or small babies. So, once women feel ready to try again for pregnancy after miscarriage, they can safely be encouraged to do so.
Daryl Efron and Harriet Hiscock

The rate of medications dispensed for attention-deficit hyperactivity disorder (ADHD) in children aged 17 and under increased by 30% between 2013-14 and 2016-17. The Australian Atlas for Healthcare Variation, released today, shows around 14,000 prescriptions were dispensed per 100,000 children aged 17 and under in 2016-17, compared with around 11,000 in 2013-14. The atlas for 2016-17 also showed some areas had a high dispensing rate of around 34,000 per 100,000 while the area with the lowest rate was around 2,000 per 100,000 – a 17-fold difference. This difference is much lower than in 2013-14, when the highest rate was 75 times the lowest. For decades people have been concerned too many children could be diagnosed with ADHD and treated with medications. We are conducting a study called the Children’s Attention Project, following 500 children recruited through Melbourne schools. So far, we have found only one in four children who met full ADHD criteria were taking medication at age ten. So it looks like, if anything, more children with ADHD should be referred for assessment and consideration of management options.

How many kids are medicated?

ADHD is the most common neurodevelopmental disorder of childhood – the prevalence is around 5% in Australia. Children with ADHD have great difficulty staying focused, are easily distracted and have poor self-control. Many are also physically hyperactive, especially when they are young. To be diagnosed, children need to have major problems from their ADHD symptoms both at home and school. These include learning difficulties, behavioural problems and trouble making friends. Young people with ADHD are more likely to fail school, have lower quality of life, experience substance abuse issues and teenage pregnancy, or end up in prison. Medication can make a big difference to these children’s lives. While there are many ways to help children with ADHD, stimulant medication is the most effective treatment. All international clinical guidelines recommend it for children with significant ADHD that persists after non-medication approaches have been offered. Our previous research found that about 80% of children diagnosed with ADHD by a paediatrician (the main medical specialty that manages ADHD) in Australia are treated with medication. The atlas shows the proportion of children and adolescents who had at least one ADHD medication prescription dispensed was 1.5% in 2013-14 and 1.9% in 2016-7. This is similar to the prevalence of stimulant medication prescription in previous Australian studies in the past 15 years. It sits between the US (high) and Europe (low) and is not excessive given the prevalence of the condition. The Children’s Attention Project found those with the most severe symptoms were more likely to be prescribed medications, as were those from families of lower socioeconomic status. Other Australian studies have found similar results. This is not surprising as ADHD does appear to be more common in children from socioeconomically disadvantaged families. Our research suggests that disadvantaged families in Australia appear to be able to access services for ADHD, at least in metropolitan centres.

Why does it vary between areas?

The atlas finding that there is considerable regional variation in prescribing of stimulant medications in Australia has been identified in previous studies and needs to be better understood. Some variation in health care is normal and good, but too much suggests there may be a problem with the quality of care or access to care. For example, greater prescribing in regional areas may reflect lack of timely access to non-pharmacological services. We do need to keep watching this space, monitoring rates and regional variation of medication use. A landmark study in the US, published in 1999, compared medication with intensive parent and teacher behaviour training. The children who received medication had a much greater reduction in ADHD symptoms. But medication is only one consideration in ADHD. Other supports are also important. Behavioural therapies can help reduce anxiety and behaviour problems in children with ADHD and improve relationships with parents and teachers. However, accessing psychologists can be hard for many families. While Medicare rebates are available for up to ten sessions per year, costs can still be a barrier. In our research, Victorian parents reported out-of-pocket costs of up to A$200 per session with a psychologist. ADHD is not considered a disability under the National Disability Insurance Scheme, so families are not eligible for funding packages. Further research is needed to better understand the factors influencing access to care for Australian children with ADHD, and why there is such variation in rates of prescribing between regions. We also need to ensure children across Australia get equitable access to non-medication management. We need evidence-based clinical guidelines relevant to the Australian healthcare system, which is quite different from places such as the UK and US. This work must include adult ADHD, which is an emerging area with a raft of clinical and service system complexities.The Conversation This article is republished from The Conversation under a Creative Commons license. Read the original article.
Suzanne Mahady

Bowel cancer mostly affects people over the age of 50, but recent evidence suggests it’s on the rise among younger Australians. Our study, published recently in Cancer Epidemiology, Biomarkers and Prevention, found the incidence of bowel cancer, which includes colon and rectal cancer, has increased by up to 9% in people under 50 from the 1990s until now. Our research examined all recorded cases of bowel cancer from the past 40 years in Australians aged 20 and over. Previous studies assessing bowel cancer incidence in young Australians have also documented an increase in the younger age group. This trend is also being seen internationally. A study from the United States suggests an increase in bowel cancer incidence in people aged 54 and younger. The research shows rectal cancer incidence increased by 3.2% annually from 1974 to 2013 among those aged age 20-29. Bowel cancers are predicted to be the third most commonly diagnosed cancer in Australia this year. In 2018, Australians have a one in 13 chance of being diagnosed with bowel cancer by their 85th birthday. Our study also found bowel cancer incidence is falling in older Australians. This is likely, in part, to reflect the efficacy of the National Bowel Cancer Screening Program, targeted at those aged 50-74. Bowel cancer screening acts to reduce cancer incidence, by detecting and removing precancerous lesions, as well as reducing mortality by detecting existing cancers early. This is important, as bowel cancer has a good cure rate if discovered early. In 2010 to 2014, a person diagnosed with bowel cancer had a nearly 70% chance of surviving the next five years. Survival is more than 90% for people who have bowel cancer detected at an early stage. That is why screening is so effective – and we have previously predicted that if coverage rates in the National Bowel Screening Program can be increased to 60%, around 84,000 lives could be saved by 2040. This would represent an extraordinary success. In fact, bowel screening has potential to be one of the greatest public health successes ever achieved in Australia.

Why the increase in young people?

Our study wasn’t designed to identify why bowel cancer is increasing among young people. However, there are some factors that could underpin our findings. The increase in obesity parallels that of bowel cancer, and large population based studies have linked obesity to increased cancer risk. Unhealthy lifestyle behaviours, such as increased intake of highly processed foods (including meats), have also been associated with increased bowel cancer risk. High quality studies are needed to explore this role further. Alcohol is also thought to be a contributor to increasing the risk of bowel cancer. So, should we be lowering the screening age in Australia to people under the age of 50? Evaluating a cancer screening program for the general population requires a careful analysis of the potential benefits, harms, and costs. A recent Australian study modelled the trade-offs of lowering the screening age to 45. It showed more cancers would potentially be detected. But there would also be more colonoscopy-related harms such as perforation (tearing) in an extremely small proportion of people who require further evaluation after screening. A lower screening age would also increase the number of colonoscopies to be performed in the overstretched public health system and therefore could have the unintended consequence of lengthening colonoscopy waiting times for people at high risk.

How to reduce bowel cancer risk

One of the most common symptoms of bowel cancer is rectal bleeding. So if you notice blood when you go to the toilet, see your doctor to have it checked out. A healthy lifestyle including adequate exercise, avoiding smoking, limiting alcohol intake and eating well, remains most important to reducing cancer risk. Aspirin may also lower risk of cancer, but should be discussed with your doctor because of the potential for side effects including major bleeding. Most importantly, we need to ensure eligible Australians participate in the current evidence-based screening program. Only 41% of the population in the target 50-74 age range completed their poo tests in 2015-2016. The test is free, delivered by post and able to be self-administered.The Conversation   This article is republished from The Conversation under a Creative Commons license. Read the original article.
Jane Heller

With several hundred cases diagnosed each year, Australia has one of the highest rates of Q fever worldwide. Q fever is a bacterial infection which spreads from animals; mainly cattle, sheep and goats. It can present in different ways, but often causes severe flu-like symptoms. Importantly, the bacteria that cause Q fever favour dry, dusty conditions, and inhalation of contaminated dust is a common route of infection. There are now fears the ongoing droughts in Queensland and New South Wales may be increasing risk of the disease spreading. But there are measures those at risk can take to protect themselves, including vaccination.

What is Q fever and who is at risk?

Q fever is an infectious illness caused by the bacterium Coxiella burnetii, one of the most infectious organisms around. Q fever is zoonotic, meaning it can transmit to people from infected animals. It’s usually acquired through either direct animal contact or contact with contaminated areas where animals have been. Goats, sheep and cattle are the most commonly reported Q fever hosts, although a range of other animals may be carriers. Because of this association with livestock, farmers, abattoir workers, shearers, and veterinarians are thought to be at the highest risk of Q fever. People who also may be at risk include family members of livestock workers, people living or working near livestock transport routes, tannery workers, animal hunters, and even processors in cosmetics factories that use animal products. Q fever can be difficult to diagnose (it has sometimes been called “the quiet curse”). Infected people usually develop flu-like fevers, severe headaches and muscle or joint pain. These symptoms typically appear around two to three weeks after infection, and can last up to six weeks. A small proportion of people will develop persistent infections that begin showing up later (up to six years post-infection). These can include local infections in the heart or blood vessels, which may require lifelong treatment.

Are Q fever rates on the rise?

In Australia, 500 to 800 cases of Q fever (2.5 – 5 cases per 100,000 people) were reported each year in the 1990s according to the National Notifiable Diseases Surveillance System. A national Q fever management program was designed in 2001 to combat this burden. This program provided subsidised vaccination to at-risk people including abattoir workers, beef cattle farmers and families of those working on farms. Results were positive. Q fever cases decreased during the program and following its conclusion in 2006, leading to a historic low of 314 cases (1.5 cases per 100,000 people) in 2009. But since 2010, Q fever cases have gradually increased (558 cases or 2.3 per 100,000 were reported in 2016), suggesting further action may be necessary. Every year, the highest numbers of people diagnosed are from Queensland and NSW. And the true number of affected people is likely to be under-reported. Many infected people do not experience severe symptoms, and those who do may not seek health care or may be misdiagnosed.

Q fever and drought

The reason people are more susceptible to Q fever in droughts lies in the bacteria’s capacity to survive in the environment. Coxiella burnetii spores are very resilient and able to survive in soil or dust for many years. This also helps the bacteria spread: it can attach to dust and travel 10km or more on winds. The Q fever bacteria is resistant to dehydration and UV radiation, making Australia’s mostly dry climate a hospitable breeding ground. Hot and dry conditions may also lead to higher bacterial shedding rates for infected livestock. The ongoing drought could allow Q fever to spread and reach people who were previously not exposed. One study suggested drought conditions were probably the main reason for the increase in Q fever notifications in 2002 (there were 792 cases that year). This was the fourth driest year on record in Australia since 1900. We still need more evidence to conclusively link the two, but we think it’s likely that drought in Queensland and NSW has contributed to the increased prevalence of Q fever in recent years.

How can people protect themselves?

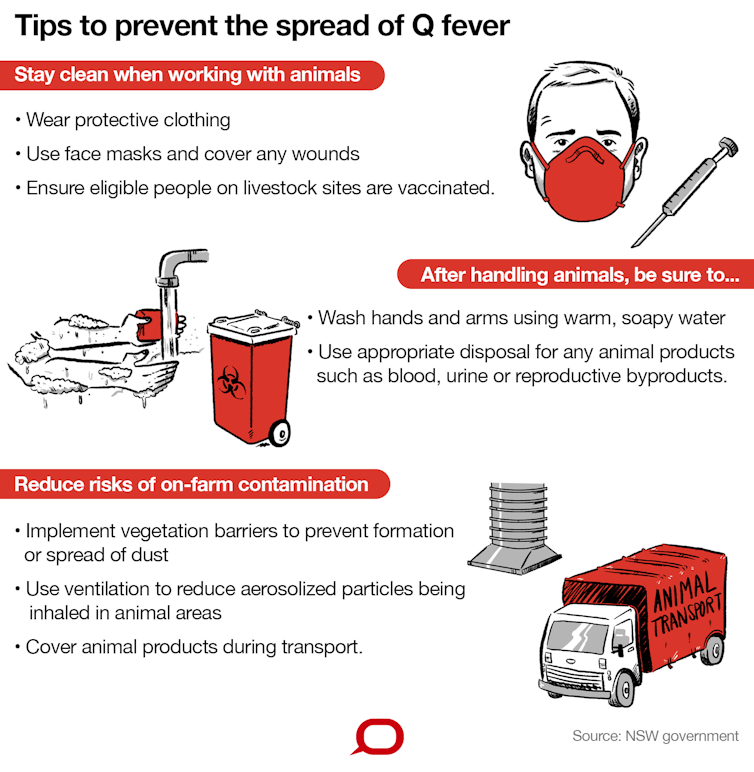
National guidelines for managing Q fever primarily recommend vaccination. The Q-VAX® vaccine has been in use since 1989. It’s safe and has an estimated success rate of 83–100%. However, people who have already been exposed to the bacteria are discouraged from having the vaccination, as they can develop a hypersensitive reaction to the vaccine. People aged under 15 years are also advised against the vaccine. Because the vaccine cannot be administered to everyone, people can take other steps to reduce risk. NSW Health recommends a series of precautions.
Author provided/The Conversation, CC BY-ND

What else can be done?

Vaccination for people in high-risk industries is effective to prevent Q fever infection, but must be administered well before people are actually at risk. Pre-testing requires both a skin test and blood test to ensure people who have already been exposed to the bacteria are not given the vaccine. This process takes one to two weeks before the vaccine can be administered, and it takes a further two weeks after vaccination to develop protection. This delay, along with the cost of vaccination, is sometimes seen as a barrier to its widespread use. Awareness of the vaccine may also be an issue. A recent study of Australians in metropolitan and regional centres found only 40% of people in groups for whom vaccination is recommended knew about the vaccine, and only 10% were vaccinated. We also need to better understand how transmission occurs in people who do not work with livestock (“non-traditional” exposure pathways) if we want to reduce Q fever rates.The Conversation Nicholas J Clark, Postdoctoral Fellow in Disease Ecology, The University of Queensland; Charles Caraguel, Senior lecturer, School of Animal and Veterinary Science, University of Adelaide; Jane Heller, Associate Professor in Veterinary Epidemiology and Public Health, Charles Sturt University; Ricardo J. Soares Magalhaes, Senior Lecturer Population Health & Biosecurity, The University of Queensland, and Simon Firestone, Academic, Veterinary Biosciences, University of Melbourne This article is republished from The Conversation under a Creative Commons license. Read the original article.
Dr Edmond Chan

  “We don’t have to live in fear anymore.” That’s the common refrain from hundreds of parents of preschoolers with peanut allergy that my colleagues and I have successfully treated with peanut “oral immunotherapy” over the past two years. Oral immunotherapy (OIT) is a treatment in which a patient consumes small amounts of an allergenic food, such as peanut, with the dose gradually increased to a target maximum (or maintenance) amount. The goal for most parents is to achieve desensitization — so their child can ingest more of the food without triggering a dangerous reaction, protecting them against accidental exposure. A recent study published in The Lancet has suggested that this treatment may make things worse for children with peanut allergies. The researchers behind the meta-analysis argue that children with peanut allergies should avoid peanuts. This study has limitations however. It did not include a single child under the age of five years old. And it runs the risk of confusing parents. My colleagues and I have seen firsthand that oral immunotherapy is not only safe, but is well tolerated in a large group of preschool children. We published data demonstrating this recently in the Journal of Allergy and Clinical Immunology: In Practice.  

Safe for preschoolers

For any parent of a child with severe allergy, the idea of giving them even a small amount of the allergenic food might give them pause. I don’t blame them — giving a child a known allergen is a daunting thought. Some allergists share this fear and do not offer OIT to patients in their clinics due to safety concerns. To assess the safety of oral immunotherapy, we followed 270 children across Canada between the ages of nine months and five years who were diagnosed with peanut allergy by an allergist. The children were fed a peanut dose, in a hospital or clinic, that gradually increased at every visit. Parents also gave children the same daily dose at home, between clinic visits, until they reached the maintenance dose. We found that 243 children (90 per cent) reached the maintenance stage successfully. Only 0.4 per cent of children experienced a severe allergic reaction. Out of over 40,000 peanut doses, only 12 went on to receive epinephrine (0.03 per cent). Our research provides the first real-world data that OIT is safe for preschool-aged children with peanut allergy when offered as routine treatment in a hospital or clinic, rather than within a clinical trial.  

The Lancet study was of older children

So why does the meta-analysis published in The Lancet show that peanut OIT increases allergic reactions, compared with avoidance or placebo? The researchers behind this study argue that avoidance of peanut is best for children with peanut allergy. They describe that in older children, the risk of anaphylaxis is 22.2 per cent and the risk of serious adverse events is 11.9 per cent. It is important for parents to note that The Lancet study only assessed children aged five and older participating in clinical trials (average age nine years old), and the researchers don’t even mention this as a limitation of their analysis. Our study, on the other hand, assessed preschool children (average age just under two years old) in the real world outside of research. While I agree that there are certainly more safety concerns in older children, and more research is needed to see which of them would most benefit, our results demonstrate with real-world data that, in preschoolers, OIT is a game-changer.  

For many patients, benefits outweigh risks

It isn’t rocket science that avoiding what one is allergic to will be safer than eating it. An analogy is knee replacement surgery. Of course, not having knee replacement surgery would be “safer” than having the surgery. But not having knee replacement surgery doesn’t provide any potential of benefits and also provides little hope for families. Likewise, telling parents of children with peanut allergy that avoidance is the only option outside research fails to take into account the negative long-term consequences of avoidance — such as poor quality of life, social isolation and anxiety. Allergists and the medical community as a whole must stop confusing parents with endless mixed messages about OIT both within and outside of research. The fact is, many allergists are already offering OIT outside of research. In our current era of basing medical treatment decisions on a comparison of risks versus benefits, there is simply no one-size-fits-all approach. Rather than concluding that all children with peanut allergy should be managed with avoidance, we should be concluding that there are some patients, such as preschoolers, for whom the benefits of offering this treatment outweigh the risks. OIT has proven to be effective in many studies, and we will similarly follow the progress of our patients long term to track effectiveness. The bottom line is this: OIT is safe for preschool children and should be considered for families of those very young children with peanut allergy who ask for it.The Conversation  

- Edmond Chan, Pediatric Allergist; Head & Clinical Associate Professor, Division of Allergy & Immunology, Department of Pediatrics, Faculty of Medicine; Investigator, BC Children's Hospital Research Institute, University of British Columbia

This article is republished from The Conversation under a Creative Commons license. Read the original article.
Dr Linda Calabresi

Increasingly, pregnant women are heeding the warnings about the dangers of pertussis and getting vaccinated but the same does not appear to be happening with influenza protection. According to an Australian retrospective analysis, pertussis vaccination of pregnant women in Victoria increased from 38% in 2015 to 82% two years later. However, when they looked at rates of influenza vaccination the prevalence fluctuated according to the season but even so, the overall rate was only 39%. Looking first at the factors that appeared to influence whether a woman got vaccinated at all, the researchers found women who were older, who were having their first child, attended antenatal care earlier in the pregnancy and who were receiving GP-led care were more likely to receive immunisation (thumbs up for the GPs). On the negative side, the likelihood of vaccination was significantly lower in women born overseas, those who smoked during pregnancy and among Aboriginal and Torres Strait Islander women. Overall it appeared the more contact a pregnant woman had with the health system, especially if that contact was with health professionals who are well-versed in all things immunisation, ie GPs, the more likely it was that vaccination would be offered, accepted and delivered. The variation in coverage rates across different hospital-led organisations reflects the fact that immunisation for flu and pertussis has not yet become part of standard, best practice guidelines for routine antenatal care. “Fewer than half the respondents indicated that vaccines were always or usually administered during routine antenatal care,” they wrote. Following on from these general observations, researchers tried to determine why it was that vaccination coverage for pertussis rose so dramatically between 2015 and 2017, and why coverage for influenza prevention didn’t. “This may reflect continued promotion by state and national bodies of the importance of maternal pertussis vaccination, and increased awareness among pregnant women of the seriousness of pertussis in infants,” they said. By contrast, the researchers suggest that influenza is often believed to pose a greater health risk to the mother as opposed to the infant, and this along with concerns about the safety of the flu vaccine itself may, at least in part, explain the poor uptake of this vaccine. To improve this situation and increase rates of protection for Australian pregnant women and their children, the study authors had a number of recommendations. Most importantly they suggest we need to build vaccination against pertussis and influenza into the standard of care for all antenatal practices – be they hospital based, midwife-led or part of the GP antenatal shared care program. Basically we need to bring vaccination up and centre into our consciousness, so women get offered the vaccine and then ensure our systems have the capacity to be able to provide this vaccination as the opportunity arises. “Maternal vaccination should be embedded in all antenatal care pathways, and systems should be improved to increase the uptake of vaccination by pregnant women,” they conclude. Other recommendations included highlighting the benefits of vaccination to those groups of women most at risk such as women who smoke and Aboriginal and Torres Strait Islander women. But key to all the recommendations is making vaccination just part of routine care. As an accompanying editorial points out, “Embedding vaccination into standard pregnancy care, whether delivered by GPs, midwives or obstetricians, normalises the process, improves access to vaccination and reduces the risk of missing opportunities for vaccination.”  

References:

Rowe SL, Perrett KP, Morey R, Stephens N, Cowie BC, Nolan TM, et al. Influenza and pertussis vaccination of women during pregnancy in Victoria, 2015-2017. Med J Aust 2019 Jun 3; 210(10): 454-62. DOI: 10.5694/mja2.50125 Marshall HS, Amirthalingam G. Protecting pregnant women and their newborn from life-threatening infections. Med J Aust 2019 Jun 3; 210(10): 445-6. DOI: 10.5694/mja2.50174
Prof Mariano Barbacid

Pancreatic ductal adenocarcinoma (PDAC), the most common form of pancreatic cancer, is the third most common cause of death from cancer in the United States and the fifth most common in the United Kingdom. Deaths from PDAC outnumber those from breast cancer despite the significant difference in incidence rates. Late diagnosis and ineffective treatments are the most important reasons for these bleak statistics. PDAC is an aggressive and difficult malignancy to treat. Until now, the only chance for cure is the complete surgical removing of the tumor. Unfortunately, because PDAC is usually asymptomatic, by the time it is diagnosed 80% to 90% of patients have disease that is surgically incurable. PDAC thus remains one of the main biomedical challenges today due to its low survival rate – just 5% of patients are still alive five years after diagnosis. However, in recent decades a number of studies have shed light on the molecular mechanisms responsible for the initiation and progression of PDAC. Our recent research has shown that progress toward a cure is possible.

Ineffective treatments

The molecular mechanisms responsible for pancreatic cancer are complex. This is why recent advances in personalized medicine and immunotherapy (which helps the immune system fight cancer) have failed to improve the treatment of pancreatic cancer. This is mainly due to two characteristics:
  • 95% of these tumors are caused by mutations in KRAS oncogenes. Oncogenes are genes that, once mutated, are capable of inducing the transformation of a normal cell into a cancerous cell. KRAS is a gene that acts as an on/off switch. Normally, KRAS controls cell proliferation. When it is mutated, however, the cells start to grow uncontrollably and proliferate – a hallmark of cancer cells. So far, KRAS oncogenes have not been able to be targeted by drugs.
  • PDACs are surrounded by abundant fibrous connective tissue that grows around some tumor types. In the case of PDAC, this tissue forms a barrier that prevents cells that recognize and attack tumor cells, called cytotoxic T lymphocytes, from reaching the inside of the tumor mass and killing its cells. This renders immunotherapy treatments useless.
For these reasons, PDAC continues to be treated with drugs that destroy cancerous cells but can also destroy healthy ones. Options include Demcitabine, approved in 1997, and Nab-paclitaxel, a new paclitaxel-based formulation. Even if such a treatment is an option, it typically only extends the patients’ lives a few weeks, a marginal improvement at best. In recent years, however, a number of studies have shed light regarding the molecular mechanisms responsible for the initiation and progression of PDAC. Today we know that most of these tumors are caused by mutations in the KRAS oncogene. They lead to benign alterations that cause additional mutations in a range of tumor-suppressor genes, which usually repair DNA mistakes, slow down cellular division or tell cells when to die. Mutated cells can grow out of control, and in this context progress to malignant PDAC. While this process is relatively well known, it has not had an immediate impact on the development of new and more effective treatments.

In search of new strategies

Multiple strategies are currently being studied in an attempt to inhibit the growth of these tumors by blocking the growth of either the tumor cells or their surrounding “shielding” connective tissue. In our laboratory, we focused on blocking the signaling pathways that mediate the oncogenic activity of the initiating KRAS oncogenes. A decade ago, our lab decided to use genetically engineered mouse-tumor models capable of reproducing the natural history of human PDAC. We did this in order to analyze the therapeutic potential of the main components of the KRAS signaling pathways. These studies have unveiled the reason why the drugs tested so far have intolerable toxic effects, with mice dying within several weeks: they target some proteins that are essential for the dynamic state of equilibrium that is the condition of optimal functioning of the cells. This is called normal homeostasis. These crucial proteins are mainly kinases, enzymes that are able to modify how other molecules function. They play a critical and complex role in regulating cellular signaling and orchestrate processes such as hormone response and cell division. These results might explain why the KRAS-signaling inhibitors tested so far have failed in clinical trials. On the other hand, the removal of other signaling kinases did not have toxic side effects, but also had no impact on tumor development. Of the more than 15 kinases involved in the transmission of signals from the KRAS oncogene, only three displayed significant therapeutic benefits without causing unacceptable side effects. These are: RAF1, the epidermal growth factor receptor (EGFR) and CDK4.

It works! (in mice)

In initial studies, we observed that the elimination (via genetic manipulation) of the expression of some of these three kinases prevented the onset of PDAC caused by the KRAS oncogene. However, its elimination in animals with advanced tumors had no significant therapeutic effects. These results caused us to question whether it would be possible to eliminate more than one kinase simultaneously without increasing the toxic effects. As described in our recent work published in the journal Cancer Cell, the elimination of RAF1 and EGFR expression induced the complete regression of advanced PDACs in 50% of the mice. We are currently studying whether we can increase this by also eliminating CDK4. The analysis of the pancreas of animals in which we were no longer able to observe tumors by imaging techniques revealed the complete absence of lesions in two of them. Two mice showed some abnormal ducts, probably residual scarring from the tumor. The others had tumor micro-masses of one-thousandth the size of the original tumor. The study of these revealed the presence of tumor cells, in which the expression of the two targets, EGFR and RAF1, had not been completely eliminated, a common technical problem in this type of study. It is significant that these results were observed not only in mice. The inhibition of the expression of these two proteins in cells derived from nine out of ten human PDACs were also capable of blocking their proliferation in vivo when transplanted into immunosuppressed mice as well as in vitro cultures.

What now?

While these results have only been observed in a subset of mice for now, their importance lies in the fact that it is the first time that it has been possible to completely eliminate advanced PDAC tumors by eliminating a pharmacologically directed target. These observations are clearly important for the development of treatments based on the inhibition of RAF1 and EGFR, but they only represent a first step on a long, hard road ahead. First, it is important to identify the differences between the PDACs that respond to the combined elimination of RAF1 and EGFR and those that are resistant. As described in our work, the analysis of these two tumor types revealed that they are not active in the same way – more than 2,000 genes are expressed differently. Identifying additional targets in resistant tumors that do not increase treatment toxicity is not going to be an easy task. To continue our tests with genetically engineered mice, the immediate but no less difficult task is the development of specific RAF1 inhibitors. Indeed, we only currently have potent drugs against the second target, EGFR. In principle, there are four possible approaches:
  • Generate selective inhibitors for its kinase activity.
  • Generate inhibitors for its binding to the KRAS oncogene.
  • Generate inhibitors for its interaction with effector targets that transmit oncogenic signaling mediated by RAF1.
  • Degrade the RAF1 protein with drugs.
Designing inhibitors of the RAF1 kinase activity would seem to be the most affordable option, given the experience of the pharmaceutical industry in designing this molecule type. The problem resides in the fact that there are two other kinases of the same family, ARAF and BRAF, whose catalytic centers (the “active core” of the enzymes) are nearly identical. RAF1 kinase inhibitors are also targeting these other kinases, which causes collateral damage. The ones tested to date have caused high toxicities and the clinical trials had to be stopped. Continuing to develop effective molecules that are capable of blocking RAF1 activity in patients with PDAC will not be easy. It will surely take more time than we hope, but at least a road map has already been outlined that shows us how to keep moving forward. Created in 2007 to help accelerate and share scientific knowledge on key societal issues, the AXA Research Fund has been supporting nearly 600 projects around the world conducted by researchers from 54 countries. To learn more about this AXA Research Fund project, please visit the dedicated page. This article was translated from the original Spanish by Sara Crespo, Calamo & Cran.The Conversation Mariano Barbacid, profesor e investigador AXA-CNIO de Oncología Molecular, Centro Nacional de Investigaciones Oncológicas CNIO This article is republished from The Conversation under a Creative Commons license. Read the original article.